Wednesday 26 September 2012

Using the charts and dashboard

Hi, here's my next post on using the dashboard charts from Google in the design of a site.  They're a very easy-to-use feature and give you a great way of quickly displaying data in a user-friendly format.


Basics

So the basics of using dashboard charts are pretty nicely covered in this article which I would advise to read first https://developers.google.com/apps-script/articles/charts_dashboard.  They're pretty easily created and then rendered onto the screen and CSS can be applied to give them some extra formatting.

For the purpose of this article I'm going to show how I've implemented them and in particular how I generated a comparative chart from 2 separate queries as shown in this screen shot where I'm running a comparative set of data.


Querying and Preparing the Data

So for my instance what I've generated is some dynamic charts which are based of data from a big query database.  There are three types of charts:


  • Pie chart for a straight summary of data
  • Bar and line charts for a "timeline" based chart of data
  • In addition bar and line charts can be used for comparative analysis between two data sets
First thing to do is query my big-query tables.  In the code I'll show I'll cover the example where I produce the comparative charts as that's the most interesting.  First, run the queries:

Interesting points to see from the code above.  First I declare two arrays - this is because the data I get back from the queries is absolute numbers and I have to do the conversion to percentages for the charts.  Also, the actual comparisons between the data sets will be from those arrays so performance is critical when you need to do subsequent data processing - and where you need performance arrays are the way to go.  Also, note the last piece of code checking if there's no data to display - if not we can then give the user a nice, friendly message.

The next bit of code is probably more difficult to make sense of but here is where I populate the array with the data from the query in percentages by keep a running total of all the values.  

So now that we have everything in the two arrays from our two queries we can really get the benefit of using arrays when we need to loop through and "join" the two sets of data based on date.  


So now we've done all the hard work we can populate our charts with the data.  Note that for the bar and line charts I pass in 3 columns of data so the charts can be shown alongside each other - you can add any number of columns in so could do even more comparisons if that's what you want.  Notice also in the last section of code I create a shorten URI using the built-in Google API so people can easily share the chart.


As always, to see this in action "for real" just check out www.socialsamplr.com

Until next time...
My next post may not be for a couple of weeks as I'm off to *hopefully* catch some trout up at lake Taupo next weekend so it'll have to wait until after that.  The next post will be on my experiences developing my own sentiment analysis engine using Google prediction.

Till then, all the best

cheers

Daniel


Monday 17 September 2012

Creating a good user experience

Creating a Compelling User Experience - part 1.

Hi, in the previous post I covered setting up Facebook logins for your Google site using OAuth 2.0.  This post will cover more around building up a nice, responsive, usable UI.  I have to confess this is not normally my number one area but for the purpose of my start-up it's something I'm having to get my head around (with some much-appreciated assistance).  Hence, this is part 1 of my journey with this but I think I've already got some interesting things to show.


Basics

The basics of building a good user experience with Google sites and Apps script gadgets is to adhere to the following:

  • Maximise the use of client events wherever possible - and I mean really maximise them, the less round trips to the server you can make, the better user experience you'll provide.
  • Make sure when you do a round-trip to the server you make it obvious to the user some processing is happening if you don't want them randomly clicking on other buttons on the screen.  Remember, GAS gadgets all run asynchronously on the server so you can get some funny behaviour if you're not careful.
  • Also, if you have really long running operations be aware of mechanisms like cache services (I haven't really had the need to use this yet but it's there if needed).  
  • All these things are also summarised here  https://developers.google.com/apps-script/best_practices  but hopefully I can give some "real-life" examples.
  • For appearances I've found it best to use in-line CSS which I'll also demo
  • Finally I make extensive use of the built in charts that come with Google Apps which are pretty awesome.  I won't go into a lot of details in this post on those, will leave them for a future post since they would have enough material to warrant it.

My Example

To see how most of this works in real-life just go have a look at www.socialsamplr.com or check out the screenshot.


Step 1 - Create the controls and make them look pretty

The first task I had was to load the controls on the page and make them look pretty - at least to me (if you think they're fugly let me know I'm always open to feedback).  This is best done by applying in-line css.  The code I wrote to achieve this is as follows.  First, create a bunch of controls.


Then apply in-line CSS to them:


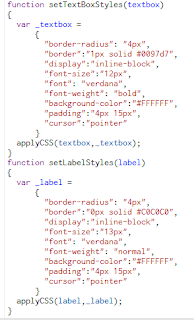
And here's a sample of the functions applying the styles.


And that's pretty much it for nice looking controls.


Step 2 - Use client events to improve the user experience

This step takes a bit more planning, but trust me it's worth it.  Using client events extensively is key to making the screen responsive to the user and creating a nice experience.

The first thing is simple, but effective.  On the screen shot shown earlier from my web app, you'll see there's two groups of drop-downs and buttons.  The lower group can be shown and hidden by toggling the label you see just above it (the label saying "Hide").  This is simply done by adding a client click event to that label which sets the visible property of those controls to false or true. A very simple but effective technique for preventing your pages being overly cluttered with confusing controls for the user.  Basically just done like this:


You'll see you create an event for the control itself forEventSource(), the one for any other controls on the screen as well forTargets.  Note, multiple forTargets can be set.

The next bit is really cool.  You can create client and server events for a control.  This is key if you want to show the user something is processing and prevent them from randomly clicking buttons (remember events are asynchronous) and stuffing up your beautiful screen you've spent all those late nights developing.  Also, it enables you to create some call Ajax-like functionality if you want.  So for the buttons on the website, here's how I achieved it.

I create a client event for a button where it sets it's own text to "Working" and also sets the background colour of any other buttons to grey.  This will then all be reset to the original colours and text once the server side event is complete.  Code is shown as follows.  First set the client events on the buttons.

  buttonRun.addClickHandler(uiApp.createClientHandler().forEventSource().setText("Working...").forTargets(buttonRunTimeline).setStyleAttribute("background-color","#C0C0C0"));

This then gets repeated for the remaining buttons, referencing the others.  For example buttonMySubject would be.

buttonRunTimeline.addClickHandler(uiApp.createClientHandler().forEventSource().setText("Working...").forTargets(buttonRun).setStyleAttribute("background-color","#C0C0C0"));

Then proceed to attach a server event to each button and make sure after the server events are run the following function is called to reset the buttons to their original state.  This is shown as follows.


Step 3 - Other tips

Some other pointers I've found helpful when it comes to reducing the server-side processing time for events.

  • Where you need to do any complex data processing use arrays - makes a big difference than iterating through rows from a ScriptDB table.
  • Where you want to change controls on a screen, load the controls from doGet() and then toggle their visibility for improved performance - much better than adding and removing controls dynamically.
  • Consider tricks like using some hard-coded initiation values for your screen when users first arrive.  The improved load-time performance can make all the difference to first time users (obviously there's a trade off with dynamically generated values).

In Summary

In summary, I'm not going to pontificate about how to make the world's most awesome UI - there's plenty of books around for that.  But for using GAS in Google Sites I've found some of these tricks have really worked.  Also, if you have time to visit www.socialsamplr.com and have any feedback I'd really appreciate it.

Next Week

Next week I'll run you through how I've created the dynamic charting on the site.  Until then, don't work too hard!

cheers

Daniel


Monday 10 September 2012

Authenticating with Facebook and Google Apps

OAuth2 Authentication for Facebook with Google Apps Script

Hi, here is a quick run-down on how I implemented OAuth 2.0 authentication via Facebook with my Google site using Apps script.  In the end it was all fairly straightforward and if anyone wants to see it in "action" you can visit my site at www.socialsamplr.com (shameless plug there).  

In the end, it was reasonably straightforward, so here goes.

Step 1 - Create your Facebook app

To do this just follow the basic guidelines at developer.facebook.com.  Note, to enable your facebook authentication to work for anyone using your site, your site will need to provide links to pages covering your privacy policy, contact details etc. about your site.  For developer testing you can run in a "sandbox" mode so won't need to provide these.  

Once done your Facebook app will look something like this.


This will then provide you with the Client ID and Client Secret you need for authentication.  Note the URLs you provide will need to match those for your site.

Step 2 - Create the authentication link in your site

To do this you need to create a Google Apps Script widget to embed in your site.  The simplest way is to create an anchor link with your client id and a unique session string which you will need to create.  This is to prevent other sites attempting to authenticate back to your site by using your session string.  In my case I create an encrypted string with some random characters appending to a date value set to the system time (and expire the string after 2 hours).  This is then stored in the script DB so when Facebook redirects back, I can use it to create the account.  The code is as follows:


The underlying Authentication.createFacebookSession() code is as follows.  Note this is the string that will be checked when it's redirect back to from Facebook on authentication.

Step 3 - Create the script for the redirection page on your site

Now that you've presented the link to the user on your site to authenticate via Facebook you need to create a widget for the page you've passed to Facebook as your redirection page (see in the link created in the anchor in step 2).  Note this gadget will need to accept the parameters passed in through the site page.  This is done through providing the arguments in the doGet() function for the page.  The first thing to process is the state parameter (the same one you created in step 2) so that you know the redirect is a valid one from your site.  Once you have these you just cycle through the parameters to get back the necessary access token from Facebook if the user has approved the request and then the user details.  Code is as follows.

Getting the parameters passed back in through the page.

Amendment to screenshot below - the following line (sorry the code was edited slightly to make it more readable and I introduced the error - doh!):

var facebookUserName=getFacebookUserName(facebookUser);

should read:


var facebookUserName=getFacebookUserName(facebookUserDetails);


And the functions being called are as follows.

And that's pretty much it.  Enough details there to get OAuth2.0 for Facebook working on your Google sites.  One note is to say the pages you have this access on will need to be under the https://sites.google.com domain (not a custom domain).  For my site I've just put most of my site under the custom domain and these specific pages in the sites.google.com domain and the feedback from most people so far is pretty positive.  There is an outstanding issue around custom domains for websites (546) to track if there's any changes here.

Any other questions, just contact me on Google +.

Cheers.

Daniel

Footnote

Just a quick note - apparently issue 546 is now fixed which is great news.  This means the authentication should be able to take place with the custom domain and not site.google.com....  I'll test this week and confirm it works.